What new ArcGIS Enterprise administrators need to see first
Using ArcGIS Monitor to build confidence through visibility
By Matthew Schulze
Bringing a new system administrator up to speed isn’t a quick process. In many organisations, it can take months before someone feels comfortable navigating an ArcGIS Enterprise deployment, and even longer before they’re fully productive. That challenge becomes even larger when the person stepping into the role doesn’t come from a geospatial background, which is more common than you might think.
At Onneer, we often meet teams where an IT generalist has suddenly inherited a sprawling ArcGIS Enterprise environment and is expected to “just know” what’s happening across dozens, sometimes thousands of services.
It’s a lot to ask.
But I’ve found a solution that makes a huge difference: giving new administrators early exposure to ArcGIS Monitor.
From uncertainty to clarity: the importance of seeing the whole picture
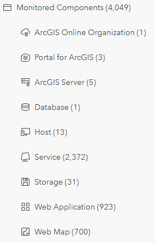
One of the first hurdles I experienced as a new administrator was simply understanding the size and shape of the system I was responsible for. Am I managing 10 services or 1,000? How many deployments are running? How many machines are involved? These aren’t small questions and answering them manually takes time.
ArcGIS Monitor cuts through that uncertainty. Its near real time dashboards give me an instant snapshot of the entire ArcGIS Enterprise environment. Instead of digging through logs, consoles, and documentation, I can see the scope of the system at a glance. That clarity alone can shave weeks off the onboarding process.
Understanding how everything is connected
If you’ve ever used a web app built on ArcGIS, you probably didn’t think about the feature services behind it or the other apps, dashboards, and workflows that might be relying on those same services. But for administrators like me, those relationships matter a lot.
ArcGIS Enterprise is full of one‑to‑many dependencies that are easy to overlook and hard to map manually. A single feature service might support multiple business‑critical applications. When something slows down or breaks, understanding those connections is the key to diagnosing the problem quickly.
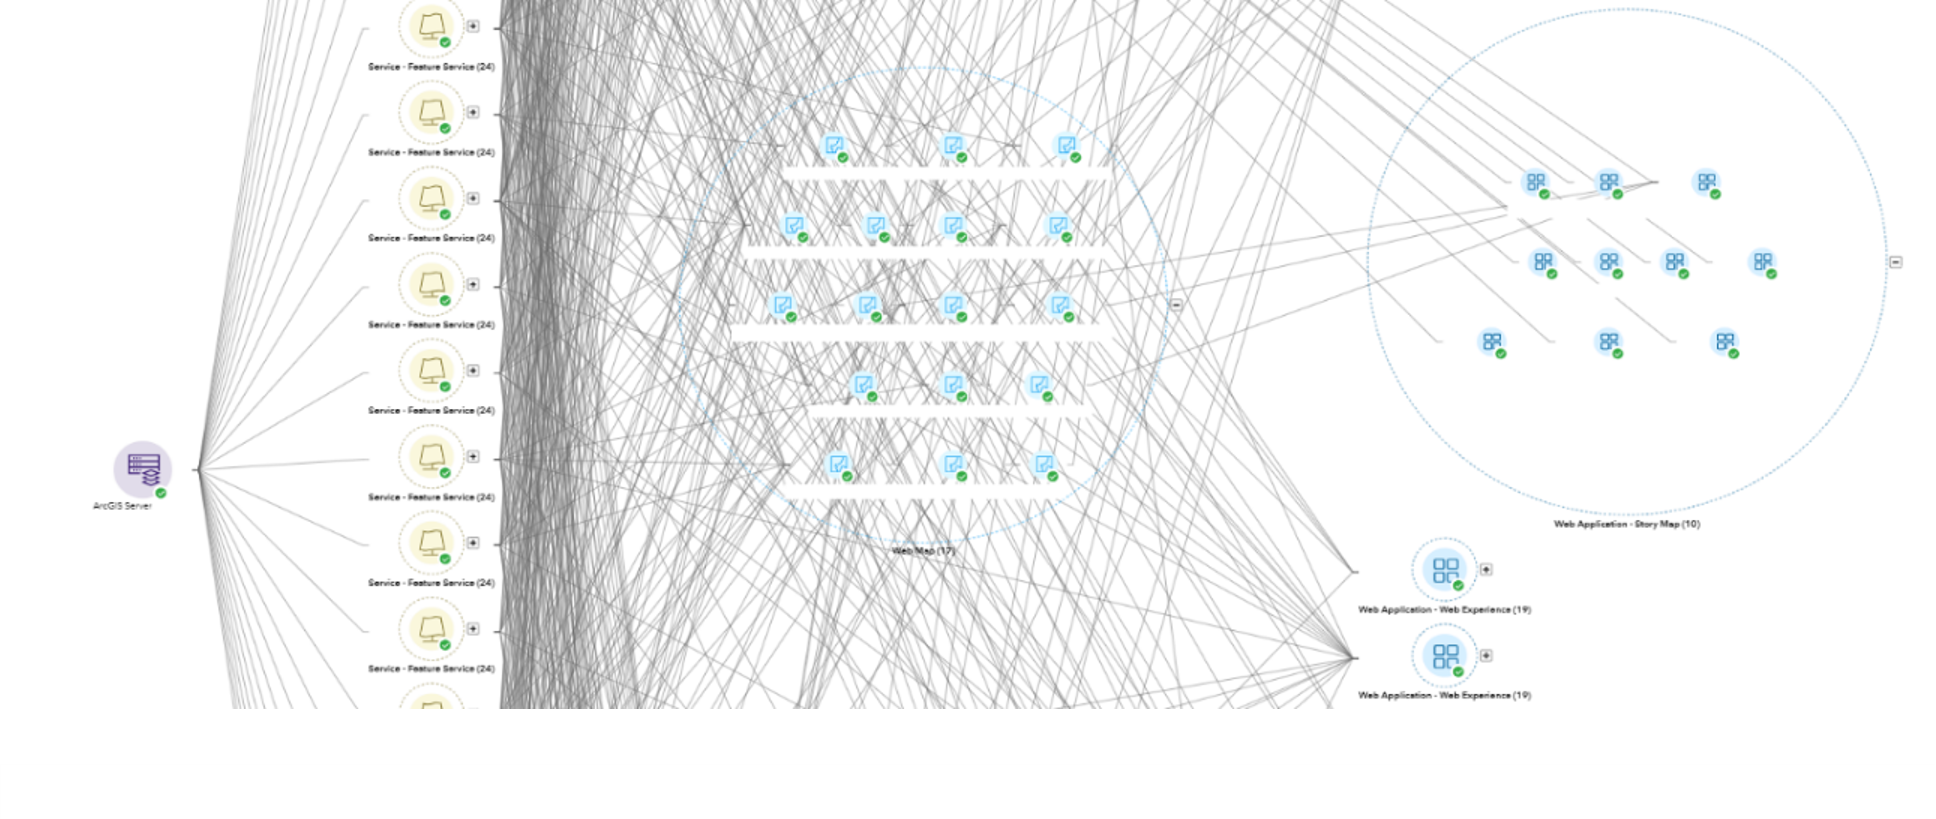
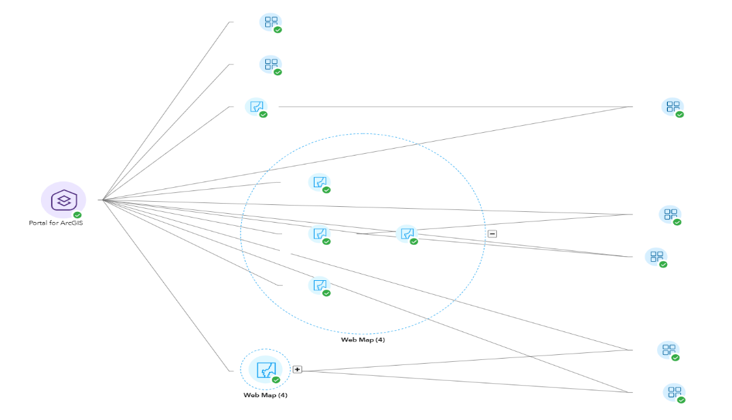
ArcGIS Monitor brings those relationships to the surface. It lays out the technical dependencies in a way that’s easy to interpret, even for someone who’s brand new to the system. At scale, this is a game‑changer. It helps new administrators understand not just what exists, but how everything fits together and why that matters.
ArcGIS Monitor also helps new administrators get their bearings by surfacing key performance indicators (KPIs) through built‑in analysis views. These ready‑to‑use dashboards bring together system activity, performance, and resource use in a clear, easy‑to‑read format, giving an immediate sense of what “normal” looks like without digging through logs or building views from scratch.
Out of the box, ArcGIS Monitor includes preconfigured analysis views which quickly provide visual representations of detailed metrics gathered across ArcGIS Enterprise and its underlying infrastructure. Among these metrics, are service response times, request patterns, CPU, memory, disk usage, and a few others which provide a quick snapshot of both application performance and system health.
To learn more about ArcGIS Monitor, you can find more information here in this Esri resource blog.
Learning the system by watching it work
What makes ArcGIS Monitor so valuable is that it doesn’t just report on system health, it also teaches us how the system behaves. Its analysis views help new administrators see patterns, understand performance trends, and recognise the impact of different workflows in near real time.
That leads to some very real benefits:
- Faster onboarding—new administrators become productive sooner.
- Better conversations— ArcGIS Monitor becomes a shared reference point for technical discussions.
- Clearer communication—executives get intuitive visuals that help them understand what’s happening and why.
- Smarter optimisation—power users can tweak workflows and immediately see the impact.
In short, ArcGIS Monitor helps people learn the system by showing them the system. It enables observability for ArcGIS systems.
More than just monitoring
Onboarding a new ArcGIS Enterprise administrator will always involve complexity. Large, long‑running GIS environments don’t come with a single source of truth, and no amount of documentation can fully replace hands‑on understanding.
This is where ArcGIS Monitor makes the difference. By making the structure, dependencies, and behaviour of an ArcGIS Enterprise environment visible from the outset, it gives new administrators a way to learn the system by seeing it in action. Instead of piecing together understanding over months, they can form a reliable mental model reducing hesitation, avoiding unnecessary risk, and accelerating their path to confident decision‑making.
Of course, that visibility doesn’t benefit the administrator alone. ArcGIS Monitor becomes a shared language and reference across IT, GIS teams, and stakeholders, improving conversations about performance, change, and optimisation. The result is not just faster onboarding, but a more resilient, better‑aligned team.
In this way, ArcGIS Monitor is more than just monitoring. It is a critical business tool that enables administrators the visibility and confidence they need to take ownership of the system.
If you’re ready to understand your system, not just monitor it, talk to our experts. We’ll help you uncover ArcGIS Monitor insights, optimise performance and support smarter decisions.