September 2022’s top five tales told in ArcGIS StoryMaps
Nanet Pagsanjan | September 2022
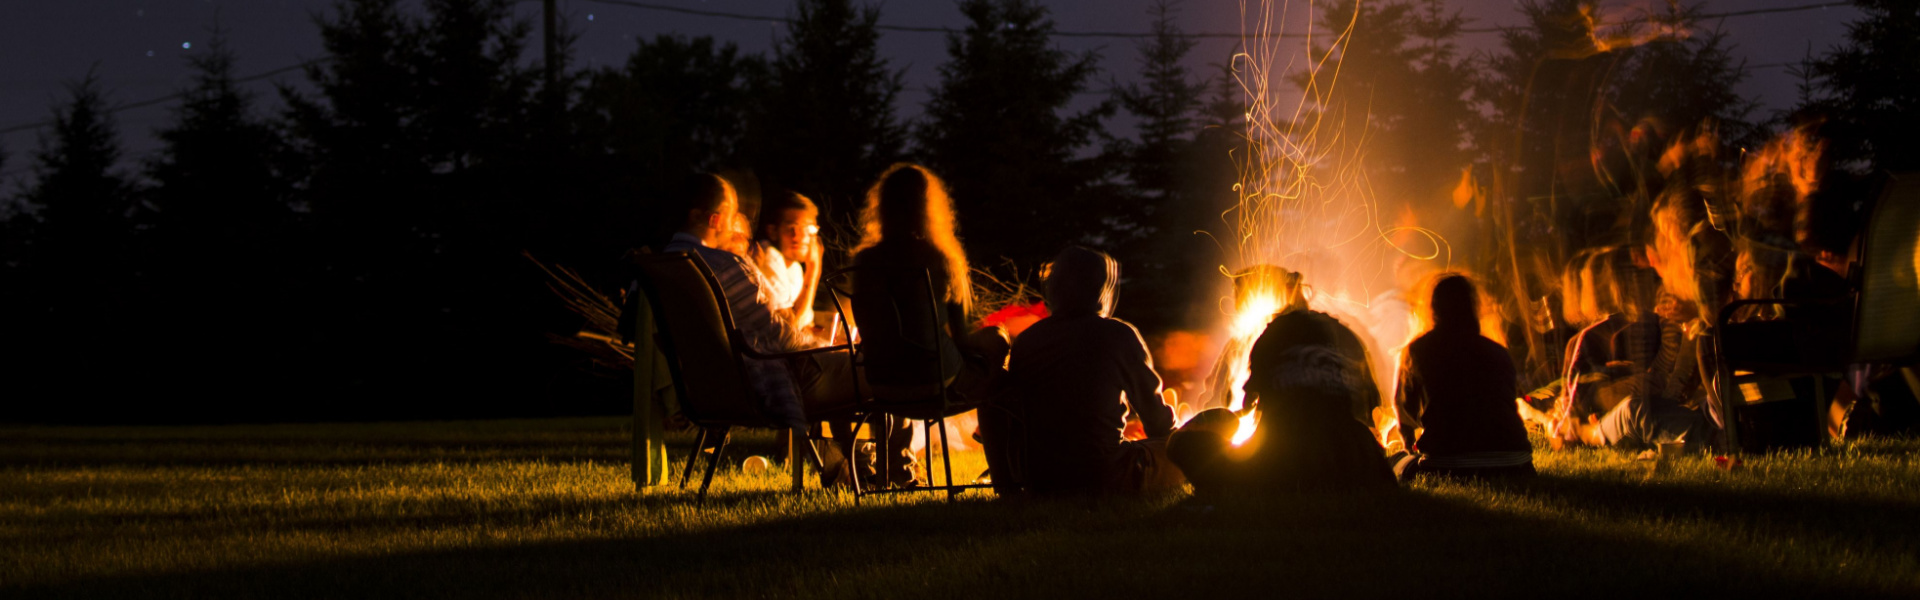
Capturing and telling stories has been happening since the dawn of time from cave wall drawings to papyrus etchings, to story tellers regaling young campers over a fire.
Let’s leapfrog to right now when the internet and the world wide web have become enmeshed in our lives, and technology and systems have evolved to a mind-boggling degree, the telling of such stories has seen an electronic format added to the arsenal.
Cue StoryMaps, an app that forms part of the ArcGIS family of software that enables a sharing of maps in a story.
These StoryMap tales have been curated based on photographs, the compelling stories and, of course, the maps they include.
Enjoy.
- Mapping and the tales it can tell
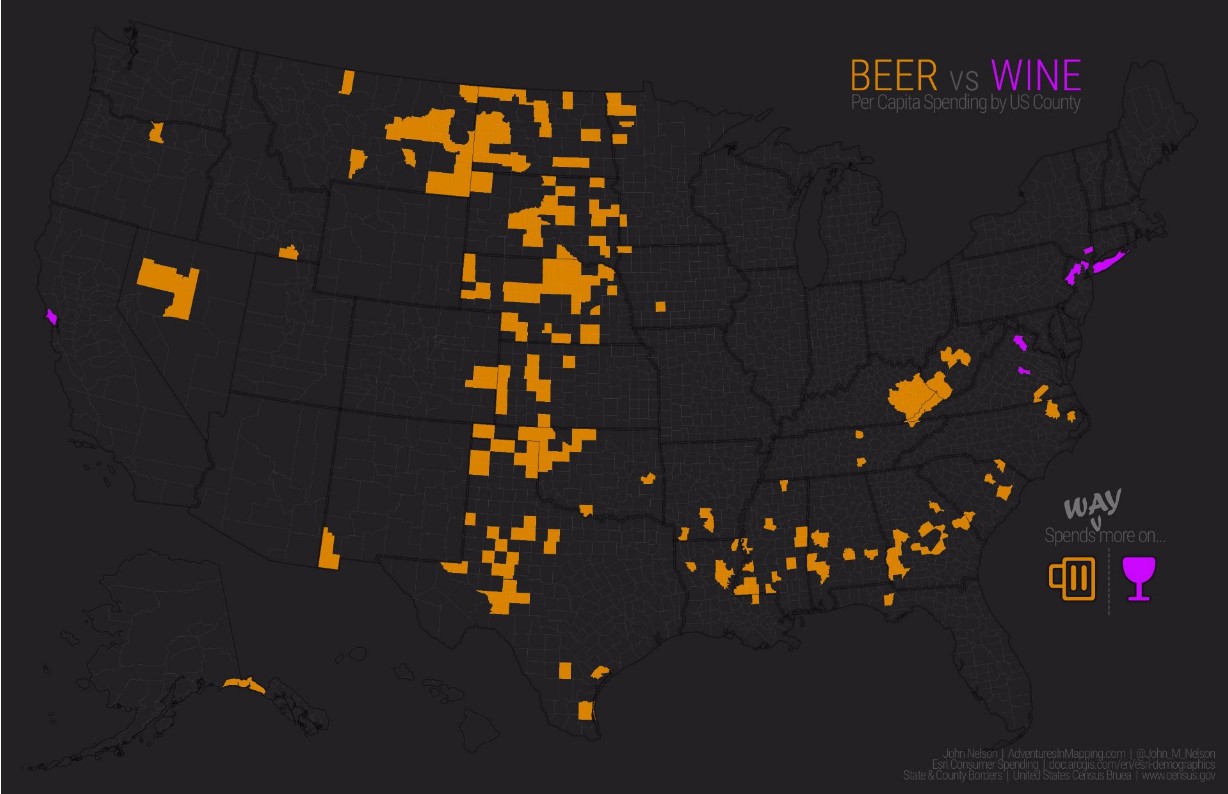
It’s the age-old question: beer or wine? Preferences can range from people just liking one, liking a combination of both, or not liking either one at all.
Here’s a tale told in StoryMaps about how the counties in the US compare in their drinking habits, but it also drills down into some of the numbers to provide a balanced story with maps to illustrate. It isn’t just about which areas buy more, it also does comparisons on several factors including population, land mass, and value in purchases.
It’s a fascinating lesson in how the power of analytics, information (specifically demography) and mapping can combine.
You’re probably now going to Google to see how Australia fares in this beer versus wine argument.
- A story about a volcano that joined two islands, then ripped them apart
It’s an astounding story captured in StoryMaps that tells the tale of Hunga Tonga-Hunga Ha’apai, two small Tongan islands that were eventually joined by a submarine volcanic eruption in December 2014, only to be torn asunder by another volcanic force some seven years later.
The images in this story are clear and dramatic showing the islands before and a year after the eruption, as land forms between them.
It captures nature at its most ferocious and capricious.
The force of the eruption in December 2021 that eventually obliterated the land between these two islands was powerful and devastating releasing hundreds of times the equivalent mechanical energy of the Hiroshima nuclear explosion.
- Flooding from around the world captured in StoryMaps
As Australians, we know that flooding is as common as the irritating hordes of flies on a summer’s day. No state is untouched by the devasting impacts of this natural disaster, not even the desert that is Alice Springs in the middle of our great country.
More recently you will have seen the impacts of the devastating floods in Lismore, NSW and in the Brisbane suburbs caused by intense rainfall, or more commonly termed, a ‘rain bomb’.
It was unrelenting rain that lasted for days, so it’s appropriate to mention this StoryMap that shows how flooding impacts areas around the globe.
This story focuses more on coastal flooding which can be caused by three things: abnormal high tide events, storm surges and persistent winds and waves. Of course, that the ocean covers nearly 72% of the Earth’s surface is a fear factor for many coastal towns.
It’s a fascinating read about Kiribati, a pacific island nation, Rotterdam in the Netherlands, Bangladesh, and New Orleans in Louisiana, US. Each environment and each issue differs from the next, but the common thread running through these places is the impact flooding leaves in its wake.
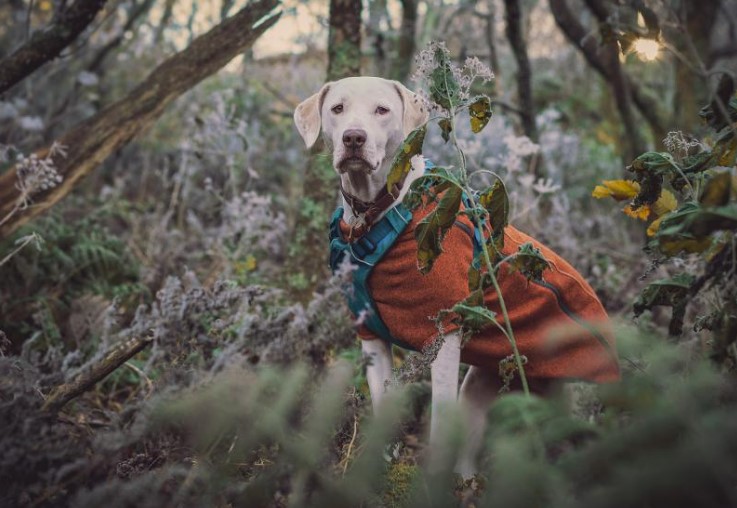
- A dog and her humans
Check out this visually delicious StoryMap about a dog and how she changed a couple’s life.
Kaya is a Labrador mix and she is adorable. Most importantly, she makes an impact on her humans for the better.
- Earwax features amongst the 147 million items in Smithsonian National Museum of History
The reason earwax is included in the Smithsonian collection will surprise you as you read this StoryMap article about the Objects of Wonder in the museum.
It is in fact Baleen whale earwax and there are over 1,000 samples in the collection. It’s significant because, much like tree rings, ear wax build-up helps tell the age of the whale. It can also be used to determine levels of pollution and stress levels in the whale’s life.
Other items that you’ll discover when you read this StoryMap include the collection of the first ever donated items to the museum and some of the first collected artifacts and, of course, where they came from.
The Smithsonian also has a biorepository that contains 4 million tissue and DNA samples.
With a museum collection this vast, prepare for a long story that includes images, maps and multimedia captured and told beautifully in StoryMaps.