
ArcGIS Monitor: Enhancing GIS administration for the Digital Atlas of Australia
Nanet Pagsanjan | January 2024
Onneer has been helping deliver a key geospatial initiative of the Australian Government since 2022, the Digital Atlas of Australia (DAA). This platform brings together national datasets from across the Australian government and connects data from a range of sources including government, community and academia.
It is a powerhouse of information providing users data about Australia’s geography, people, economy, and environment, and allows them to explore, analyse, and visualise data by location. In its beta format, this evolutionary capability is built on Esri’s ArcGIS Enterprise with components also available through ArcGIS Online.
A key enabler for Onneer’s GIS administration team is the inclusion of ArcGIS Monitor, a specialist tool in the solution designed just for GIS administrators like us.
We wouldn’t be without it.
ArcGIS Monitor enables the Digital Atlas GIS administration team to stay on top of the performance of its multiple ArcGIS Enterprise deployments, enabling the early identification of potential issues and speedy resolution. It also allows a proactive approach to the system itself as we use ArcGIS Monitor to check for any aspects of the system running consistently high, and initiate fixes as needed.
Thanks to ArcGIS Monitor, Onneer runs a lean administration team, while ensuring that adequate time is available for other administrative tasks such as patching, changes and upgrades.
Increased efficiencies
As a system changing constantly through both increased uptake and a staged implementation/evolution program, we use both automated and manual monitoring to gauge the health of our deployments.
Using ArcGIS Monitor, we carry out a range of complementary manual checks to determine the overall system health by monitoring the various system resource availability, taking note of the impacts of use and system change simultaneously. The health checks enable us to keep a watchful eye on ArcGIS Enterprise’s portal health, server health, server federation status and general server response times.
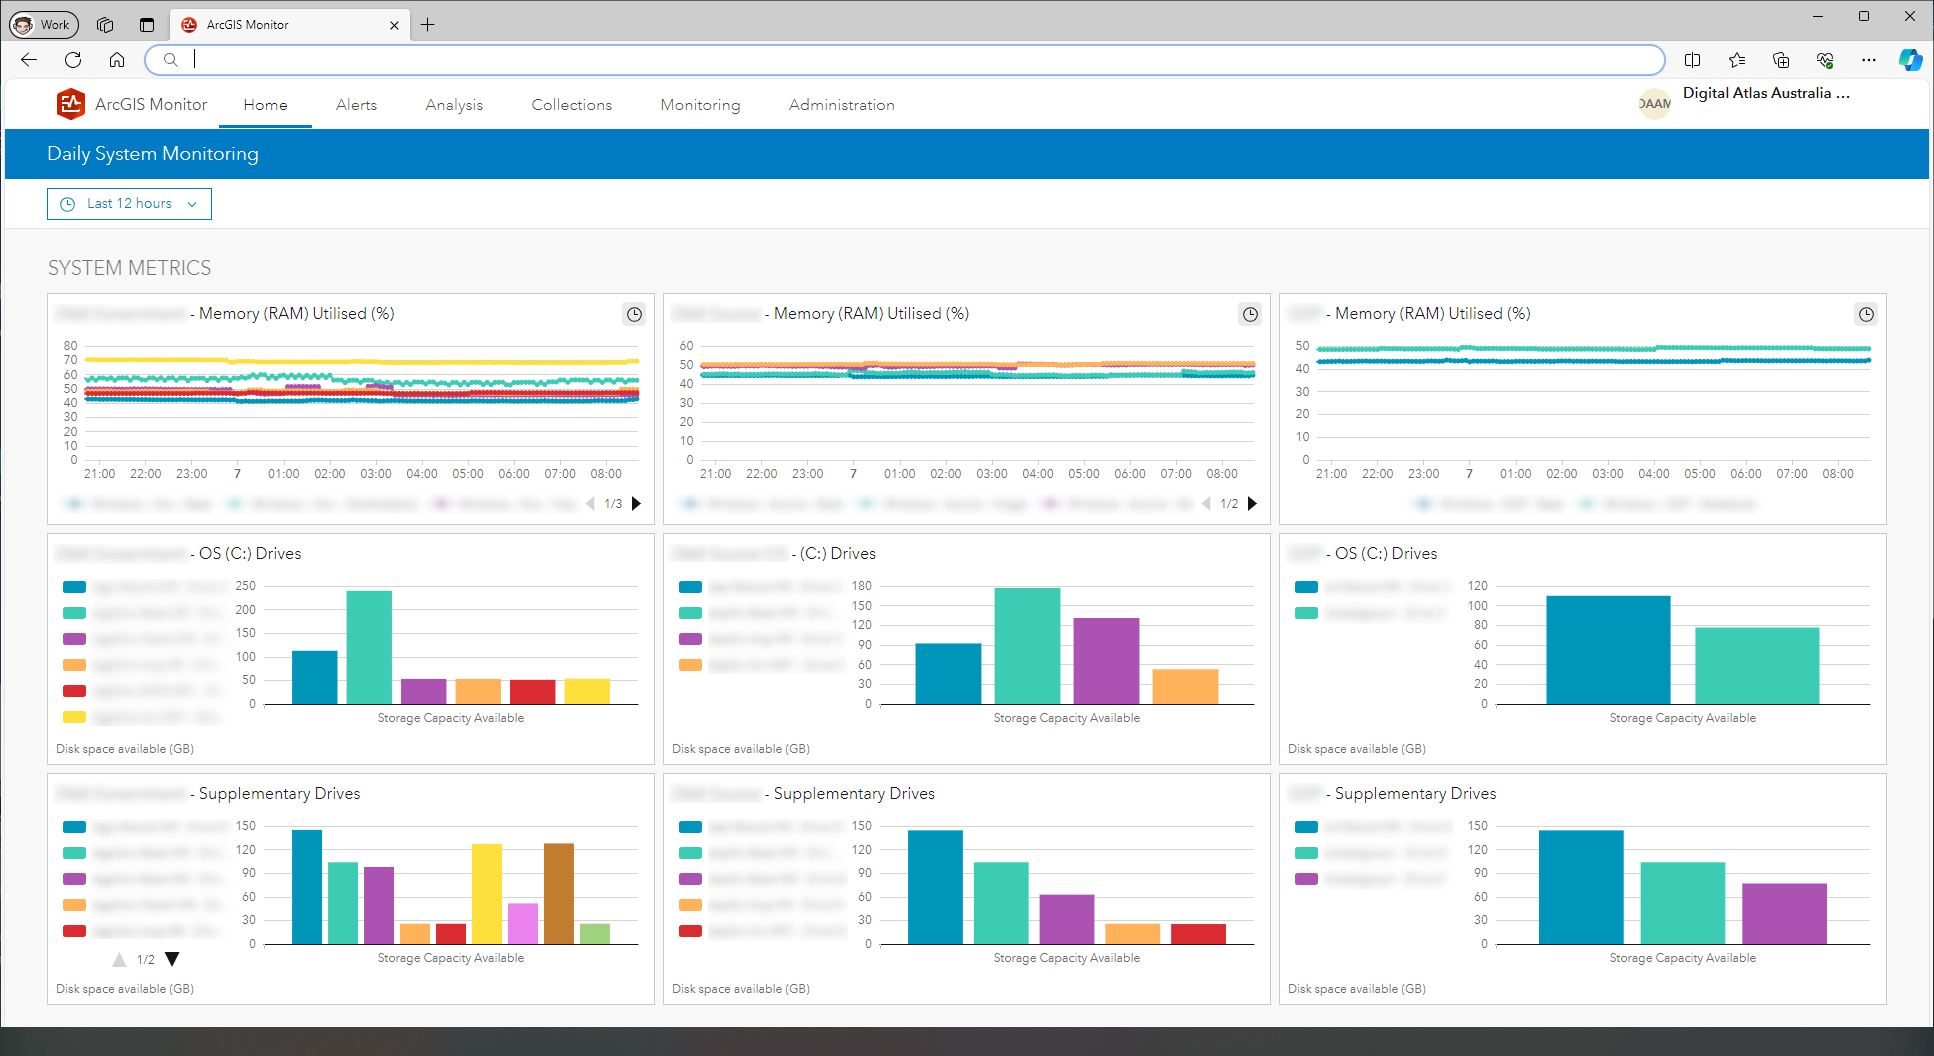
As a manual process, these daily system checks would typically take lots of effort and time as we navigate and authenticate across our deployed servers, through multiple secure systems. In fact, do this each day over the course of a year, and before you know it, you’re looking at around 50 to 70 days of labour.
ArcGIS Monitor also gives us the ability to securely collect data and display it on a single live dashboard which can be accessed via a web browser. This feature alone has reduced one to two hours of work to a simple 30-second check.
Automatic alerts to prevent disaster
It could be said, however, that ArcGIS Monitor’s real triumph lies in its ability to monitor the vast ArcGIS Enterprise system, each component comprehensively and simultaneously then sending email alerts as thresholds are reached.
We’ve configured such notifications to send real-time alerts based on thresholds and criteria and depending on the desired state of the system. Some alerts have even been tailored to be highly sensitive while others less so. The use of average thresholds is a particularly useful technique we have found in the configuration and tailoring of our alerts.
The ability to configure notifications like this means when we do receive an alert, we know there’s urgency behind them.
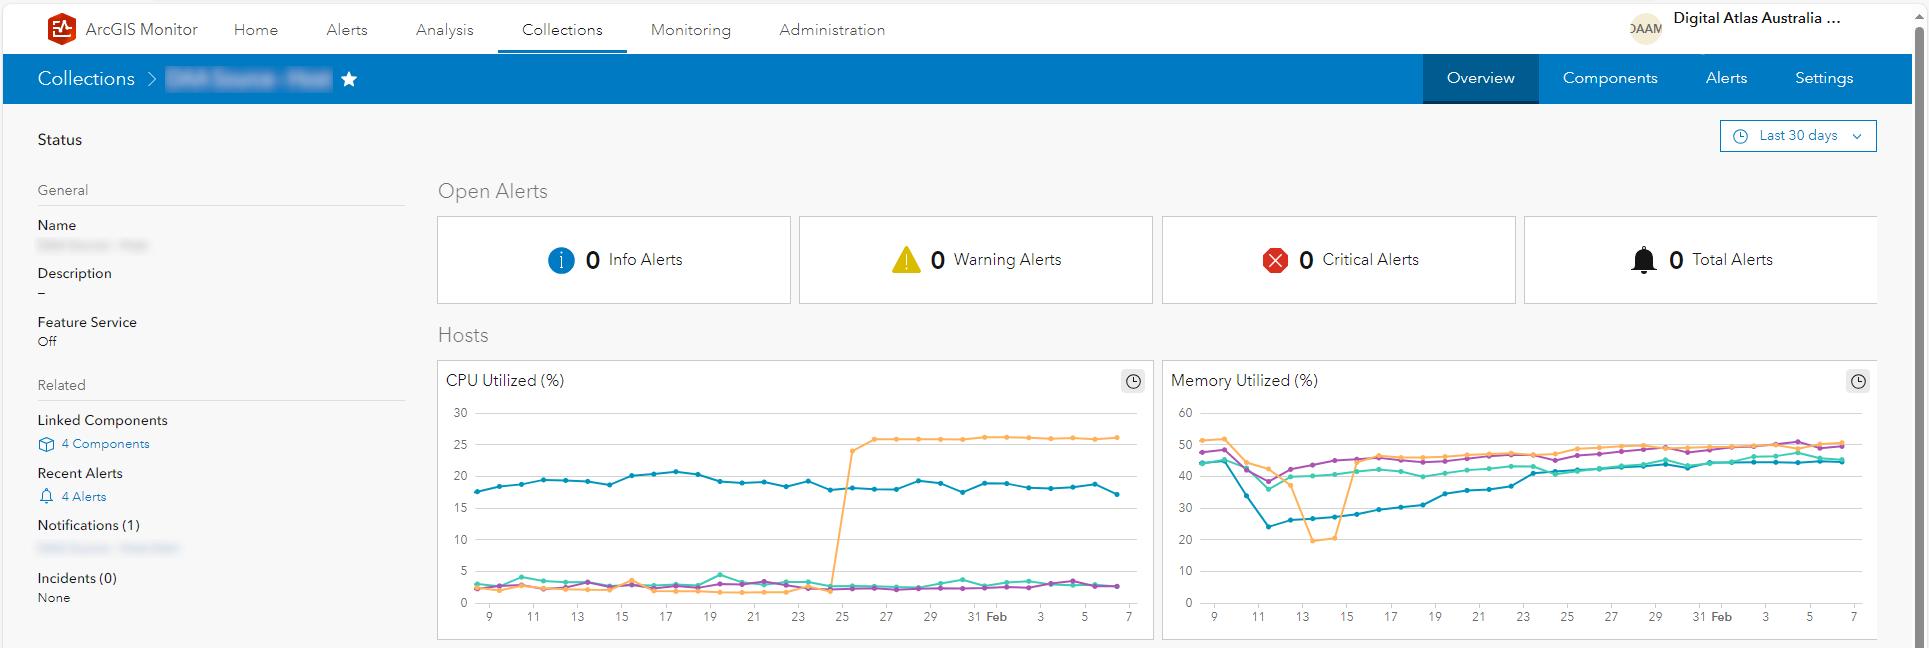
For example, most recently when a user managed to publish a Godzilla-like service, its use placed significant strain on the system. ArcGIS Monitor alerted us immediately.
A simple click on the link provided in the notification email took us to a dashboard which showed us exactly what was happening from a system perspective. On this occasion, the CPU on a specific server was running steadily before it suddenly jumped to 100% utilisation and remained there. This gave our administrators a head-start looking for where the problem was and clearly outlined its significance. Through ArcGIS Monitor, they could quickly open the associated logs, identify the user having difficulties, and assist in rectifying the problem before other users even noticed any change to system performance.
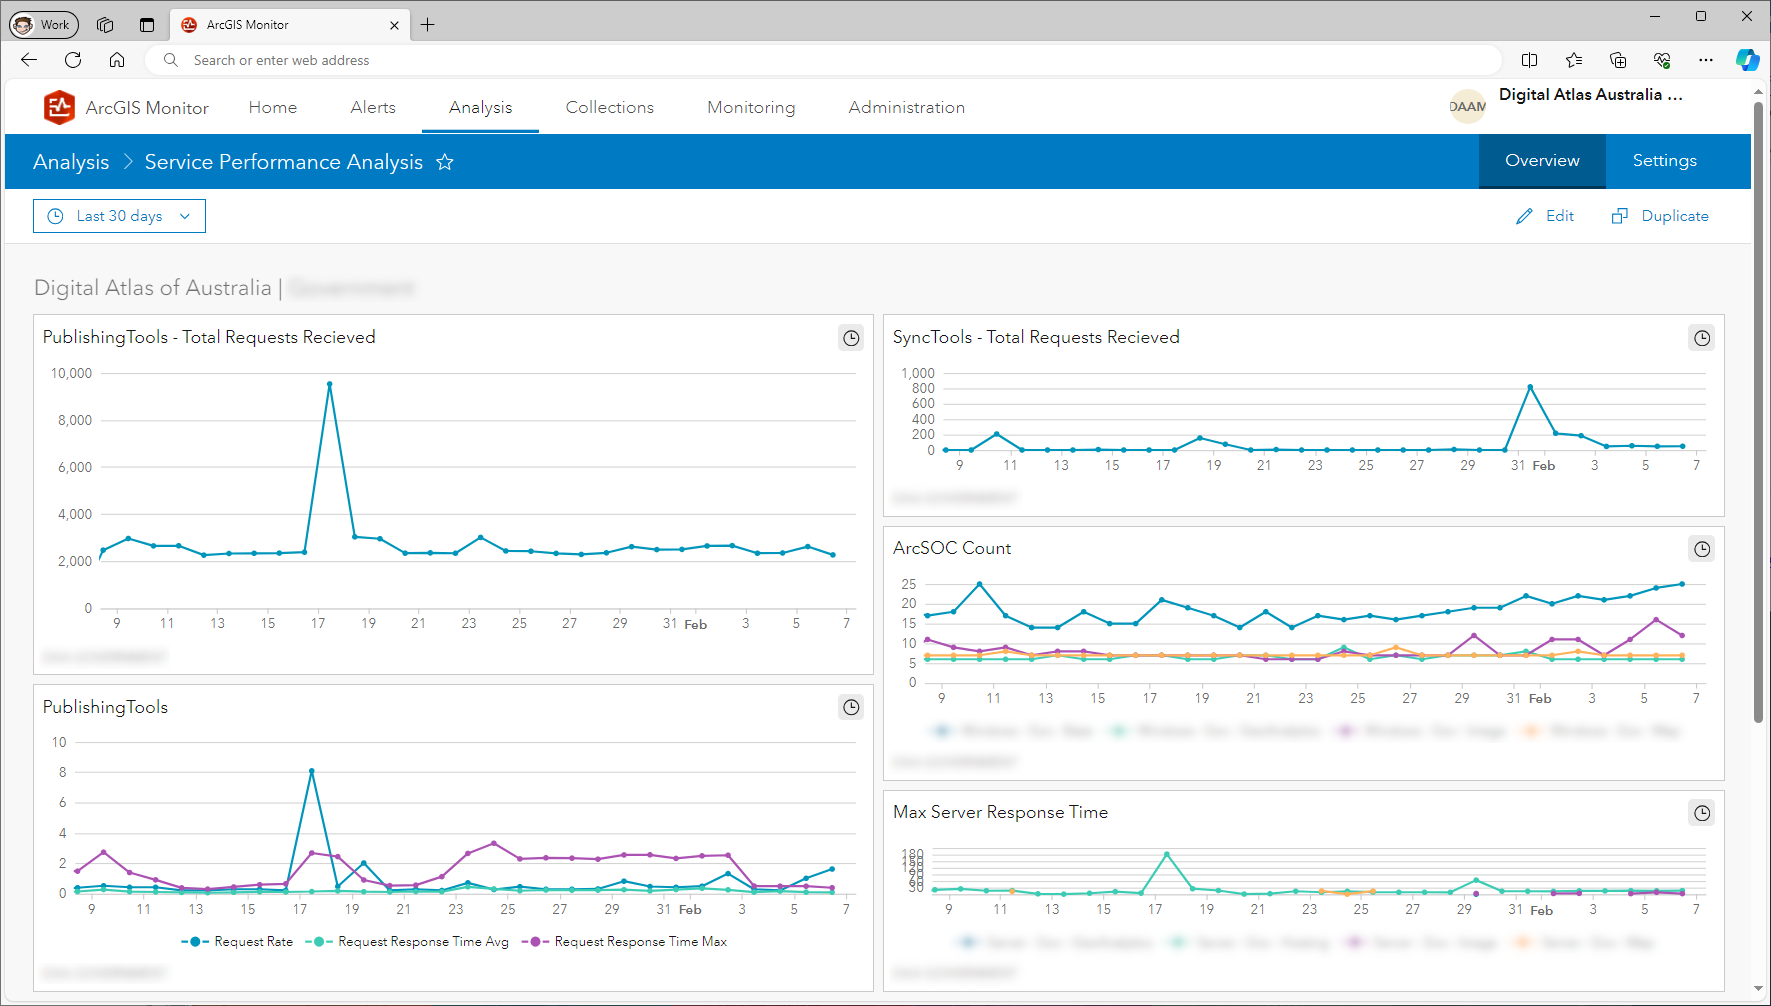
Using metrics analysis to improve the system
An added benefit to ArcGIS Monitor is that it enables live viewing of system metrics and also preserves these metrics for use with analysis views. By tailoring these interactive dashboards specifics around areas of interest to system administrators and system managers could be displayed.
This feature was most useful when we increased the size of available CPU cores in our staging system. After the upgrade, we wanted to see the impact this change had on the system. We created an analysis view on the dashboard and set the timeframe to show system performance a week prior to the upgrade, and a period after the upgrade. The improvement was evident in ArcGIS Monitor’s system metrics and graphs illustrating the benefits of the upgrade.
These graphs were a critical part of the post-decision expense justification of tuning the system in this way, demonstrating a clear return on investment to the client.
We’ve also used ArcGIS Monitor to establish the root cause of numerous sporadic outages by creating these analysis views on our dashboard tailored to capture against specific metrics.
In one such scenario we could clearly identify a conflict between two Scheduled Notebooks running on one of our ArcGIS Notebook Servers. We fixed the problem by adjusting when the Notebooks operated and noted the future need to increase system resources if multiple similar uses occurred in the future.
As ArcGIS specialists, we’ve deployed nearly every version of ArcGIS Monitor in its lifetime and this level of troubleshooting illustrated in these examples would typically take hours, if not days to conduct. ArcGIS Monitor is a critical component which works alongside DAA monitoring in Azure Monitor focusing on what our GIS administrators need to know at the application layer and how the configurations, use and resources interact together.
We’ve used this incredibly useful tool in our arsenal to optimize enterprise GIS implementations like the DAA and with it identify issues and help provide timely insights on system performance, resource utilisation, and more. The future bodes very well as the Digital Atlas of Australia continues on its evolutionary path with ArcGIS Monitor keeping an eye on it behind the scenes.
Onneer | info@onneer.com.au